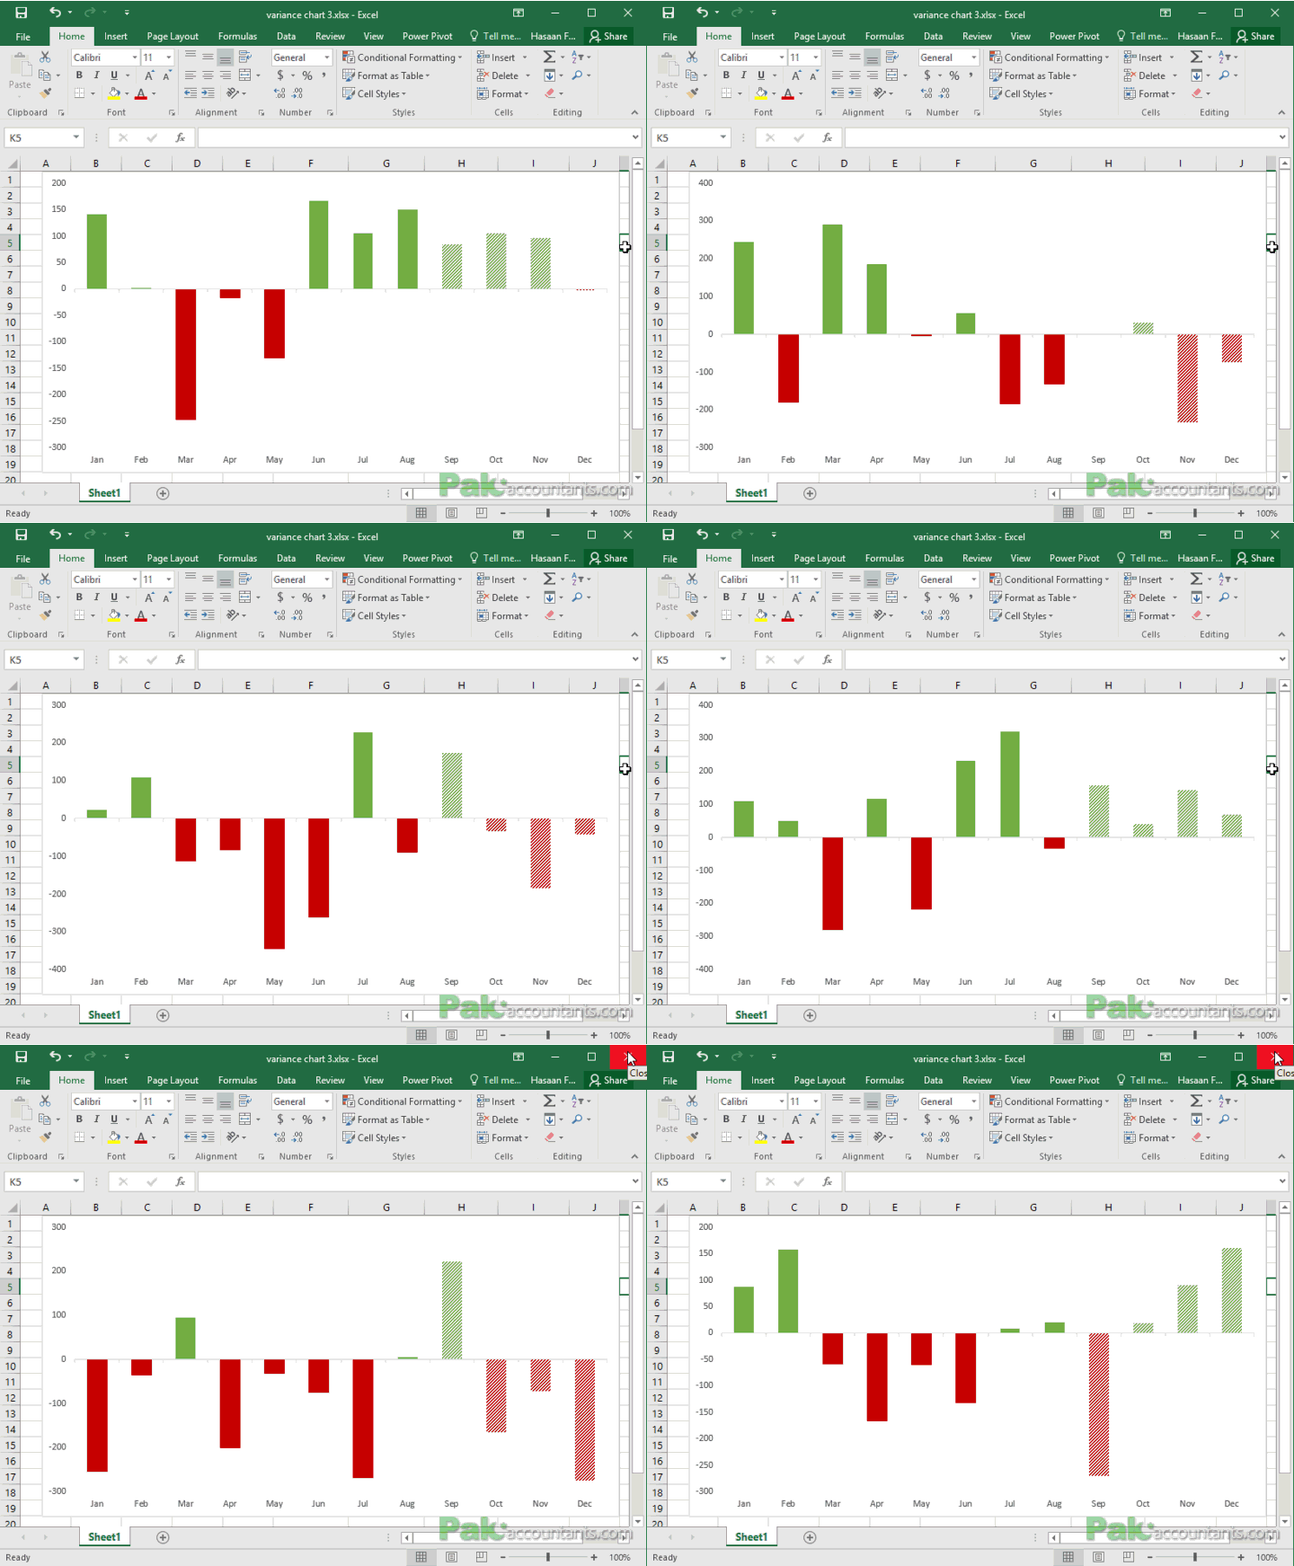
Moving X-axis labels at the bottom of the chart below negative values in Excel
By default if you insert a bar chart or line chart, the x-axis labels are stuck at 0 position of the axis. This usual behaviour gets in the way especially if you have negative values in the data that are plotted against y-axis in which case x-axis labels will overlay the lines or bars. Have a look at the following! Classical case of a mess:
Hating it right? It sure is something to hate. But it is an easy fix if you know it. So how to fix it?
Simply right click on x-axis labels > click format axis. Formatting panel will open at the right. Scroll down to labels options > expand them if you have to and from label position drop down select Low.
Tada! Now as it is out of the way your chart can flex and update as the data changes without any visual disruption!


Leave a Comment