
Top 5 Excel Chart Hacks You Should Know in 2020
Top 5 Excel Chart Hacks You Should Know in 2020
Use familiar charts format: (Excel Chart Hacks)
Although it may look much more sophisticated and complicated to use highly multidimensional chart formats to represent your data in the excel dashboard, it is highly unadvisable. Instead, you should use the chart formats your managers and executives are already familiar with. The major advantage of this is that most such senior executives are habituated to reading the same and can easily assimilate the data represented in these chart formats.

Keep charts simple: (Excel Chart Hacks)
This is a PowerPoint trick one must remember when going for any visual representation of data. Using graphic, dashboard, animation to woo your audience is one thing, but trying to decorate your chart too much with unnecessary background decorations can be hazardous. This is because it diverts the attention of the reader from the actual purpose of the chart. Also, it doesn’t really add any new information to it. Hence, while making your excel dashboard, just as while making your powerpoint presentation, one must remember that less is more.

Here, instead of using the first one it is more advisable to use the second format for your charts.
Avoid transmitting information using colour codes: (Excel Chart Hacks)
Colour codes are not universal per se, except few like red and green. Hence, you should avoid trying to represent any information on your charts with just colour codes. If used, such codes should be accompanied by an index telling the readers specifically what is meant by each colour.
Careful while using pie charts and other graphs:
You should always take extra care while using any graphs and charts on your dashboard, especially the pie charts. Pie charts happen to be the most controversial visual representation of data since it is very easy to misread. Hence, it is generally advised to avoid using pie charts at your workplace excel dashboards. If used, such pie charts should not have more than six segments, in order to ensure that the chart is simple to read. The same also goes for any other graphs where lots of divisions are necessary to transmit the data. If six segments are not enough in any such case, it is advisable to use a different graph altogether instead of making the same graph way too complicated to read.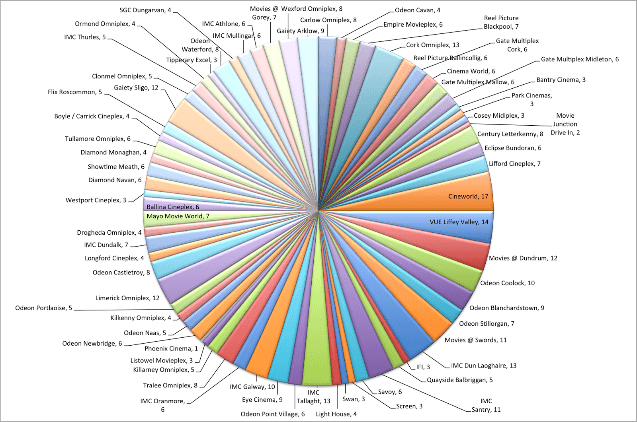
Using animations:
It is true that graphics, dashboard, animations attract the reader to concentrate more on your presentation, but you should always be careful not to overdo the same. It should always be kept in mind that no graphics, dashboard, animations, howe ver unique, add any value to the presentation of data. Hence, the amount of animation used has to be limited to the level of attracting the audience. If such animation exceeds the right amount, it might make the presentation confusing and give it a cluttered look instead of helping your cause.
#evba #etipfree #eama #kingexcelver unique, add any value to the presentation of data. Hence, the amount of animation used has to be limited to the level of attracting the audience. If such animation exceeds the right amount, it might make the presentation confusing and give it a cluttered look instead of helping your cause.📤How to Download ebooks: https://www.evba.info/2020/02/instructions-for-downloading-documents.html?m=1


Leave a Comment