
Perform Sentiment Analysis in Excel
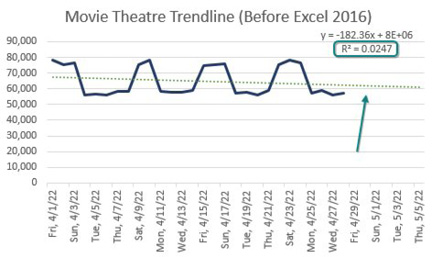
Before Excel 2016, Excel offered a few forecasting tools that did not fit in every situation. If your sales data included some seasonality, the old forecasting tools would do a bad job. Consider a movie theatre where sales peak on the weekend and plummet on Monday. Using the old linear trendline, Excel shows an R-Squared of 0.02, meaning that the trendline is doing a horrible job of predicting the future.
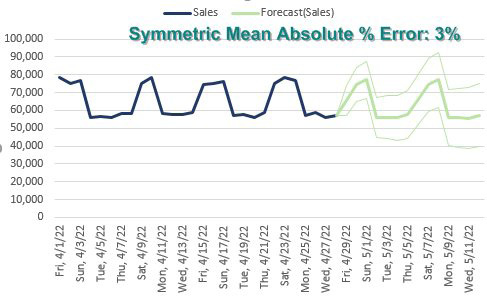
Excel 2016 introduced a new set of forecasting functions and an icon on the Data tab of the Ribbon to create a Forecast Sheet. If you have data with Date in column A and Sales in column B, select the data and choose Data, Forecast Sheet.
In the Create Forecast Worksheet dialog, click Options and review the Seasonality and ask for stats. Click Create and Excel inserts a new worksheet with FORECAST.ETS functions to create a forecast. The 3% error shown means that this forecast is explaining most of the variability.
Caution
The Forecast Sheet works fine if you have one level of seasonality: More movie-goers on Friday or more gift buyers in November and December. But if your real-life data calls for both a December boom and a Saturday/Sunday peak, the FORECAST.ETS won't handle it.
📤You download App EVBA.info installed directly on the latest phone here : https://www.evba.info/p/app-evbainfo-setting-for-your-phone.html?m=1
#evba #etipfree #kingexcel


Leave a Comment